

Long list of 2022 billion-dollar weather disasters gets even longer
CHICAGO - The early estimates on the damage caused by Ian are astounding. It might very well rank among the top five costliest storms in U.S. history.
It could cost around $250 billion according to property analysis firm Corelogic. It will be part of a growing list of billion dollar weather disasters this year.
There is still two months left to the Atlantic hurricane season. Who knows how many other types of weather disasters could strike over the next three months remaining in 2022 in addition to more hurricanes?
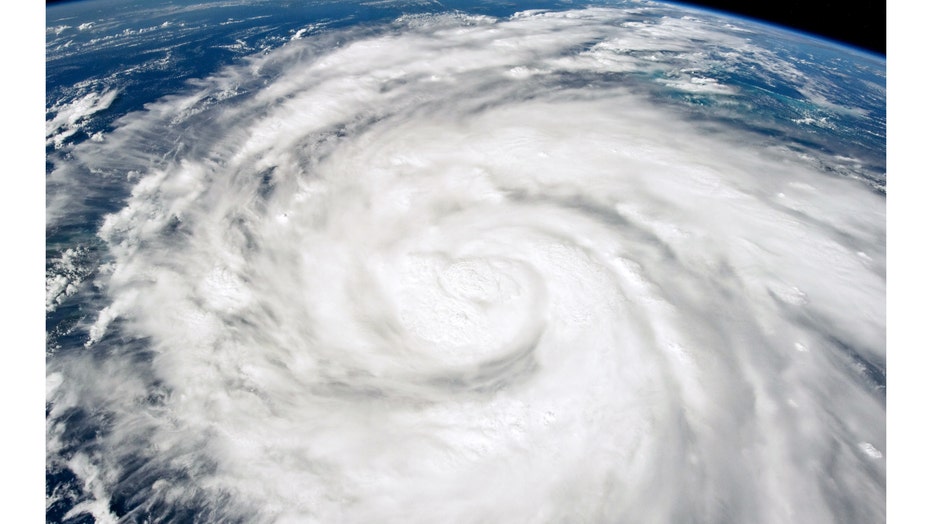
Satellite Image Of Hurricane Ian From NASA
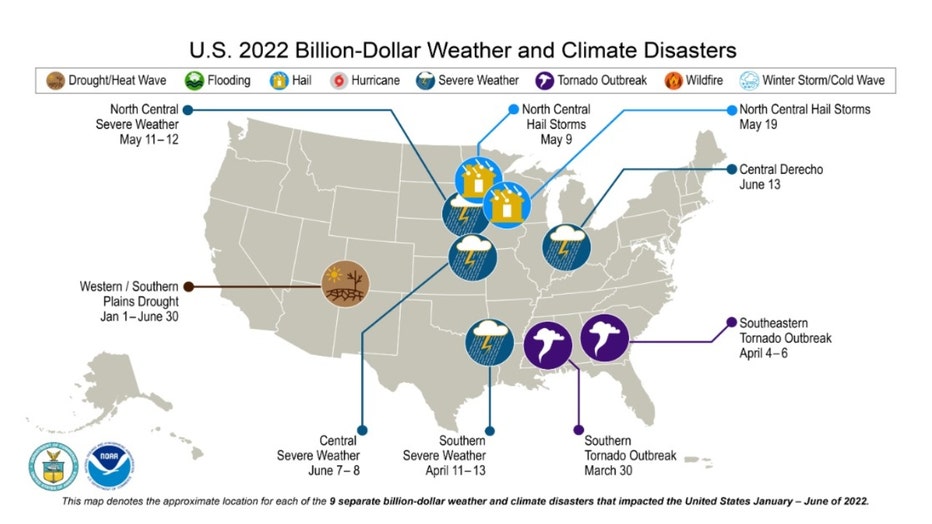
There have been nine billion-dollar weather disasters in the U.S. through the middle of July this year. Spanning the years 1980-2021 the annual average is 7.7 events but during the past five years, that annual average has jumped to 17.8 events.
Last year, there were 20 billion-dollar events according to NOAA. 2021 was the third-costliest year in U.S. history. The cost of the weather disasters last year exceeded $152 billion in damages.
No one seems immune from these costly disasters. Every state in our country, along with Puerto Rico and the Virgin Islands, have had at least one billion-dollar disaster since 1980. The number is going up in part because of climate change. Higher property values coupled with more people moving to coastal counties, where they may be vulnerable to hurricanes like Ian, also contributes to the increase.
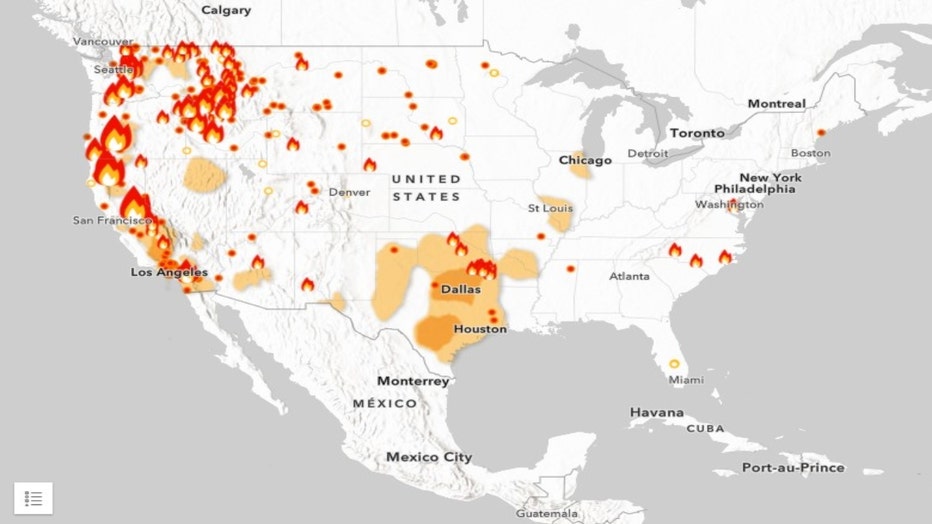
A new website launched by the Biden administration is designed to show the impact climate change is having across our country. It allows you to project a few to several years into the future and compare it to historical trends. The five types of weather disasters it focuses on include extreme heat, flooding, coastal inundation and wildfires.
Here is a description of how the Climate Mapping for Resilience Adaption (CMRA) website works from its developers:
"Climate Mapping for Resilience and Adaptation (CMRA) integrates information from across the federal government to help people consider their local exposure to climate-related hazards. People working in community organizations or for local, Tribal, state, or Federal governments can use the site to help them develop equitable climate resilience plans to protect people, property, and infrastructure. The site also points users to Federal grant funds for climate resilience projects, including those available through the Bipartisan Infrastructure Law."
There is another new tool launched this year by Climate Central that lets you see the local influence of climate change every day. The Climate Shift Index (CSI) shows how much climate change "has altered the frequency of daily temperatures at a particular location".
This tool helps us to remember that climate change shouldn't just be though of in terms of long-term trends but also as something that can impact our daily lives.
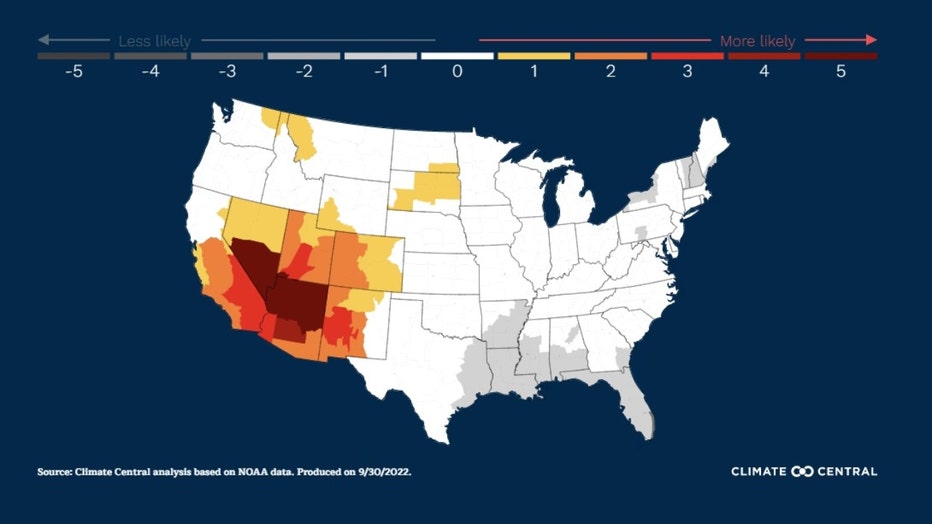
Climate Shift Index For Low Temperatures September 30th, 2022
Here is how Climate Central says these maps should be interpreted:
The Climate Shift Index has 11 levels: five positive, five negative, and one representing no change.
CSI levels from +1 to +5 indicate that human-caused climate change has made the observed or forecasted temperatures more likely or, equivalently, more common.
CSI levels from -1 to -5 indicate temperatures that are becoming less likely or less common due to human-caused climate change.
The CSI is part of the growing field of attribution science. It looks at how much climate change has impacted a weather event to make it more intense and/or more likely to happen. Scientists are already attributing Ian's rapid intensification to climate change.
The American Red Cross is just one way you can help contribute to Florida's recovery from Ian.